Documentation
The first thing in your program should be
documentation, such as the following. This should
appear at the very top of your program.
% hmwk3.m
%
% Author: (Your Name)
% Account: (your account
name)
% CSc 4630/6630 Program #3
%
% Due date: (put the due
date here)
%
% Description:
% (Give a brief
description of what your program does.)
%
% Input:
% (State what the program
inputs are.)
%
% Output:
% (State what the program
outputs are.)
%
% Usage:
% (Give an example of how
to use your program.)
% (For example: out =
myabs(in); )
%
Verify that the command
help hmwk3
shows this information.
Objectives
Assignment
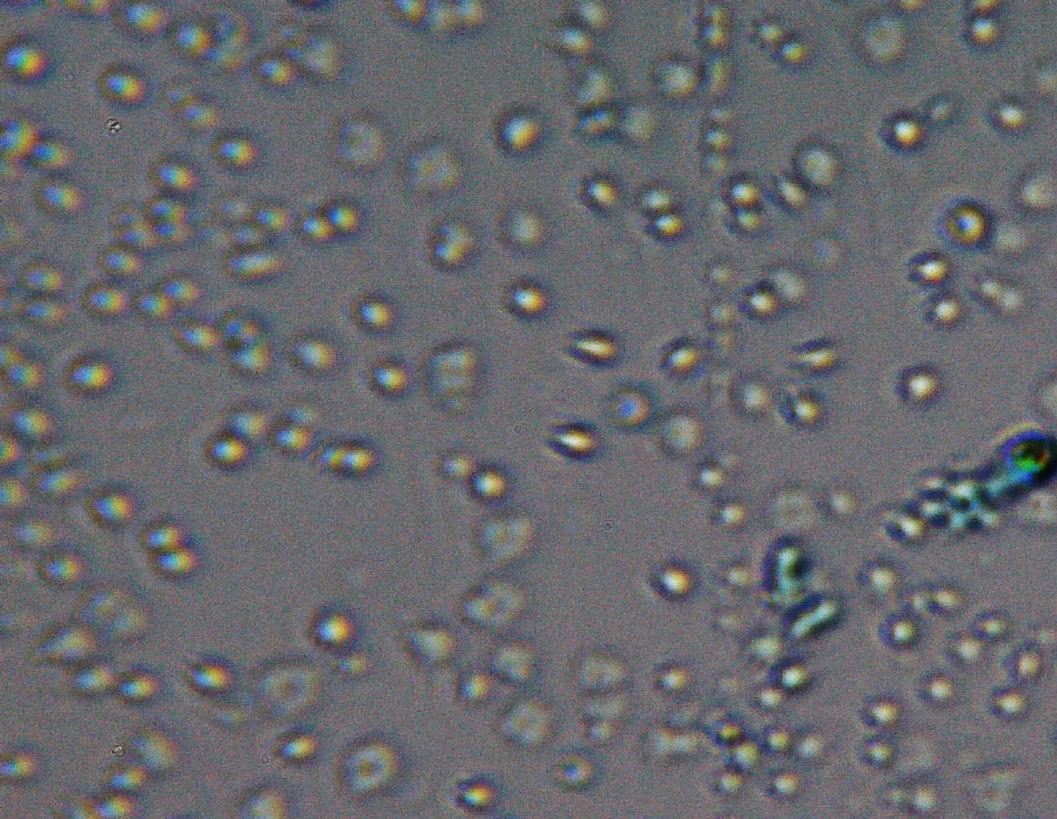
Microscopic images provide a view that we cannot normally see.
Sometimes, scientists need to get information from microscopic images,
such as a count of cells in an area, that is then multiplied by a factor
to approximate the amount of cells in a given volume.
However, manually counting the cells is exhausting. When we only need
a good approximation, why not have the computer do it for us?
There is an image available of saccharomyces cerevisiae at 400 times magnification. Your task is to make a program that counts the cells. First, you will need to read the image with the "imread" command. You can see the image with the "imshow" command, like "imshow(x);". Then you can convert the image from a color image to a logical image with the "im2bw" command, such as "y = im2bw(x);". This is results in a matrix of 0's and 1's. Use "imshow" to see the result.
Now comes the challenging part, where your program needs to count the cells, the large white blobs in the logical image. It should ignore any tiny white blobs. For our purposes, we assume that any group of fewer than 10 interconnected pixels should be ignored. We will consider two pixels to be "interconnected" if we can go from one to the other by moving along an 8-point compass direction. That is, if we can move, say, North-East from a 1 to get to another 1, then they are interconnected.
Write a function to scan the image and look at small squares. If the square contains only a few interconnected 1's, it should replace them with 0's. Below are some examples.
Show the original image in one figure, then the logical figure in another, and the post-scanned logic figure in a third figure. You can call up a new figure with "figure()", or you can specifically call up figure 3 with the command "figure(3);". Any "imshow" command after that, or "plot", "stem", etc., will be shown on that figure.
Print the name of the file, plus the cell count, to the command window, Also, use "title" to show this information on the third figure.
Here we only have 3 interconnected 1's:
0,0,0,0,0,0,0,0,0
0,1,0,0,0,0,0,0,0
0,1,1,0,0,0,0,0,0
0,0,0,0,0,0,0,0,0
0,0,0,0,0,0,0,0,0
0,0,0,0,0,0,0,0,0
0,0,0,0,0,0,0,0,0
0,0,0,0,0,0,0,0,0
so they should be replaced with 0's.
Here we only have a few interconnected 1's:
0,0,0,0,0,0,0,0,0
0,1,0,0,0,0,0,0,0
0,0,1,0,0,0,0,0,0
0,0,0,0,0,0,1,0,0
0,0,0,1,0,0,0,0,0
0,0,1,1,0,0,0,0,0
0,0,0,1,0,0,0,0,0
0,0,0,0,0,0,0,0,0
so they should be replaced with 0's.
Here we have many interconnected 1's, and one that is not connected:
0,0,0,0,0,0,0,0,0
0,1,1,1,1,0,0,0,0
0,1,1,1,1,0,0,0,0
0,0,1,1,1,0,1,0,0
0,0,0,1,0,0,0,0,0
0,0,0,1,0,0,0,0,0
0,0,0,0,0,0,0,0,0
0,0,0,0,0,0,0,0,0
so the single 1 in row 4, column 7, should be replaced with a 0.
The rest should stay.
Here we have some interconnected 1's:
0,0,0,0,0,0,0,0,0
0,0,0,0,0,0,0,0,0
0,0,0,0,0,0,0,0,0
0,0,0,0,0,0,0,0,0
0,0,0,0,0,0,0,0,0
0,0,0,0,0,0,0,0,0
0,0,0,0,0,0,0,1,1
0,0,0,0,0,0,1,1,0
should they be replaced with 0's?
That depends. What is to the right, and what is below them?
If this is the bottom-right corner, we should replace them all
with 0's. If, say, the row below that is all 1's, then we should
not replace them. Have your scans overlap to deal with this.
How do you count the cells? Once you have a matrix of logical values that are significant (i.e. the ignorable data is removed), scan the matrix and increment the count whenever you find a 1. The tricky part is to not count any of the other 1's that are connected to it.
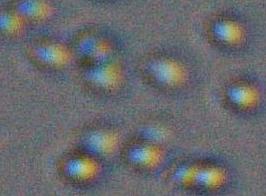
The image is fairly large. How do you test your program out, and add to it iteratively? There is another image that is much smaller. You might want to work with it until you are confident that your program works.
Your solution should be a script, with at least one function. Use the "type" command to print the function(s) and script to the screen. Also, you might prefer to work with the reverse of the logical image, i.e. "y = 1 - im2bw(x);" so that the background is white. If you print the image, this will likely save you money as it uses less ink.
As with all programs:
Your program should work for all possible inputs. Make sure that you test it with several different cases. For example, how do you handle the edges?
Turn In Your Work
The printouts of the above must be handed in at the start
of class. To be considered "on-time", you must
e-mail the TA with the final version of your code before the due date,
and turn in all of the above on-time.
If your work is more than 1 page and not stapled,
it may be returned to you without a grade.
Make sure that your printouts use a monospaced font.