CSc 4110/6110 Embedded Systems
Lab Experiment
Instructor: Dr. Michael Weeks
Temperature Control
This lab will introduce you to the temperature control.
Embedded systems programming is probably different from the programming you are
used to, since it presents an interface to the user, and user
interaction generates events.
See the program tempControl.ino. This
should be used as a starting point. You will have to alter it.
The website buildr.com
has a tutorial on the sensor probe, including getting and using the
OneWire library
(that you will need for this lab).
Notes on safety:
Be careful working with the equipment in this lab, especially since it
involves water. Water DOES allow electricity to flow (supposedly
pure water will not, but the water you will use does contain salts and
other chemicals that do allow electric flow).
- Plug the Switch-Tail II into a ground fault circuit interrupter (GFCI).
This will shut off the electric flow if there is a problem.
You probably have (a) GFCI outlet(s) in your home or dorm. If not, these
can be purchased for a reasonable price and are a smart thing to have.
- Make sure to use the grounding strips any time that you work on
electronics.
- Use a drip-loop in any cable that needs it. A drip-loop is where
the cable has slack, forming a point well below the outlet, such that
any water on the cable will accumulate at that point and drip off instead
of flowing into the outlet.
Put a pot of water on the burner. Put the temperature probe into the
pot, and secure it so that it does not move around. Plug the burner
into the Switch-Tail II, and connect the Switch-Tail II leads to the
Arduino.
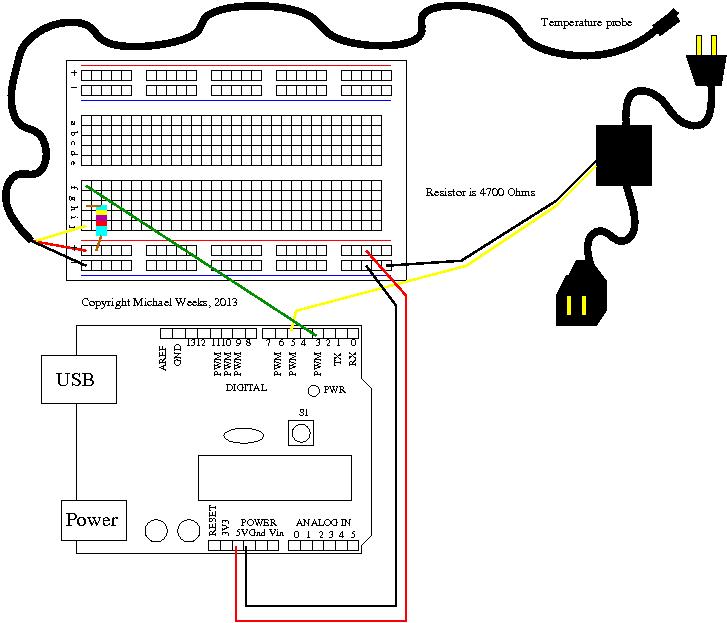
In the video that I showed the class, the Power switch tail II has
1 +
connected via the white wire to the Arduino pin 3, and
2 -
connected via the black wire to the Arduino ground.
Use red wire for the
1 +,
and black wire for the
2 -
connections if you can.
It's OK if you have different colors for wires, or use something different
than pin 3,
but be sure to wire it correctly.
Also connect the temperature probe to the resistor and Arduino, being
VERY CAREFUL to get the wiring correct. Failure to do so may burn out
the probe. Use a 4.7k Ohm resistor (color bands are Yellow, Purple, Red).
Once the code has been uploaded, turn on the Serial Monitor (see the
icon on the upper-right corner of the Arduino window).
Your goal is to heat the water up to 50.0 degrees C, and keep it there.
Turn the burner on, being careful.
Plug the Switch-Tail II into a Ground Fault Control Interruptor, if possible.
Record the temperatures, at least once per second.
Copy the output from the serial monitor, and save it to a file (called
myfile.txt in the example below).
Edit the file, to remove any misformed lines. For example, you may have
something like "0:0:0 60.8 C, Target: 65Low temp - turning on the burner."
in one of the first few lines, as the Serial Monitor starts up.
The "65Low" are a temperature and message strung together,
and this can cause problems when we try to plot the data.
Also, remove any text-only lines, such as "Low temp - turning on the burner."
Make sure that each line contains a data point. An easy way to do this is
to use the grep utiliity, as in this line:
grep : myfile.txt > myfile2.txt
Use a utility, like
awk to isolate the data. For example,
awk '{ print $2", "$5", "$10 }' < myfile2.txt > mydata.csv
will put the
three numbers into a comma-separated-value (CSV) file.
Then use a program to plot the numbers, such as MATLAB:
y = csvread('mydata.csv');
plot(y.');
title('Plot of temperature data by Your Name');
Put a copy of your plot in your lab report.
Questions
- How much water did you use? How do you think this impacted your
results?
- What kind of container did you use? Did this have any impact
on your results?
- What was the temperature (of the water) when you started?
How long did it take to initially raise the temperature to the
target temperature?
- You probably saw some variation in temperature.
After getting to the target temperature, what was the highest
temperature, and what was the lowest temperature?
-
For the measured temperatures after reaching the target temperature,
produce an error signal, defined as the measured temperature minus
the target temperature. (MATLAB is a good choice to answer this
question, but you instead could use a spreadsheet or write a program.)
Divide the error signal into groups according to zero-crossings.
That is, put the positive values into the first group until you
run into a negative value. Then put the negative values into
the second group until you run into a positive value. Then put the
positive values into the third group until you get to a negative value,
etc.
For each group, what were the accumulated
over-shoots in degrees per second? What were the accumulated
under-shoots? (That is, add all the values of the first group together
and record that number. Then repeat this will every group until you
have a sum for each group.)
Adding all the accumulated over-shoots together, how does this
compare to the sum of all the accumulated under-shoots?
What to Turn In
Follow the directions on Lab Report format, given on the class web-page.
Write-up what you did IN YOUR OWN WORDS. Do not simply re-word the
directions,
but explain what is going on. Avoid listing steps. Use outside sources
as appropriate, and be certain to cite your sources.
If you copy and paste ANY text, put it in double-quotes and include a
citation immediately after it.
- Include your answers to the questions.
- Include a printout of your code.
You only need to include the files that you changed.
For example, creating a new application project may in turn
create a files. If you do not
change those files, you do not need to include printouts of them.
- Clearly indicate the author (and source) of any code, such as out of a
book or from a web-page. If you modified it, clearly state this.
- Include a screen-capture of the simulator's
screen (or Arduino's serial interface screen),
when there is something to see. For this assignment, one screen
capture is enough.
-
Do keep electronic copies of any files, in case the TA or professor
asks for it.
Do NOT turn in excessive printouts.
Instead, for a long print-out (like the temperature log),
you can show it with an ellipsis: print the first few lines,
print an ellipsis
(three periods in a row ("...") on a line by themselves),
then print the next few lines of interest, print another ellipsis,
repeat as needed, then show the last few lines.
You can also put this in anytime you need;
it conveys the idea that you are skipping something similar and
non-note-worthy.
You can also do this for code that someone else wrote, e.g. to show
lines that you changed.
- Turn in one report per person.
- Make sure it is stapled.
- Include on the lab when your appointment with the TA to demonstrate
your lab is (or was). It is your responsibility to demonstrate your labs
to the TA. The time you and the TA agree on is up to you. You are required
to set this up BEFORE turning in the lab.
Please see the link to the lab format.